Inox Wind | Quick Take
August 20, 2018
INOX Wind
BUY
CMP
`101
TAILWIND ahead
Target Price
`130
Inox Wind is India’s leading wind energy solutions provider servicing IPPs, Utilities, PSUs,
Corporates and Retail Investors. Inox Wind is a fully integrated player in the wind energy
Investment Period
12 Months
market with three state-of-the-art manufacturing plants in Gujarat, Himachal Pradesh
and Madhya Pradesh with a cumulative manufacturing capacity of 1,600MW.
Stock Info
Significant revenue improvement: Wind energy sector has seen tectonic
Sector
Capital goods-Wind Turbine
transformation in FY2018 due to changes in Auction regime from FIT regime to Reverse
Market Cap (` cr)
2,251
auction regime, which removes counterparty risks and default in payments. Owing to
reduction in uncertainty like PPA (Power Purchase Agreement) and connectivity, we
Beta
0.9
expect participation in bidding to increase along with the increasing effort of GoI for
52 Week High / Low
158.4/75
auctioning of 10GW wind energy every year till 2028. This would create strong revenue
Avg. Daily Volume
55,482
visibility for wind turbine manufactures like Inox Wind going forward. We expect Inox
Face Value (`)
10
Wind to report `3,360cr and `3,971cr revenue in FY2019E and FY2020E respectively
BSE Sensex
37,974
owing to majority of executions from SECI-I and SECI-II orders.
Nifty
11,470
Strong order book: Inox Wind bagged orders from all the central wind power auctions
Reuters Code
INOX.BO
conducted by the Solar Energy Corporation of India (SECI) during FY2018 under the
Bloomberg Code
auction regime. It also bagged 50 MW in the Maharashtra State auction, which has
INOX IN
enhanced its auction based order book to a sector leading candidate with 950 MW in
the Indian wind power industry. This provides Inox Wind with strong execution visibility
Shareholding Pattern (%)
over the next 12-18 months.
Promoters
75.0
Outlook & Valuation: We expect Inox Wind to report exponential growth in top-line
MF / Banks / Indian Fls
0.4
and bottom-line over FY2019-20E. The growth would be led by changing renewable
FII / NRIs / OCBs
7.8
energy industry dynamics in favor of wind energy segment viz. changes in auction
regime from Feed-In-Tariff (FIT) to reverse auction regime and Government’s guidance
Indian Public / Others
16.8
for increasing wind energy capacity from 34GW currently to 140GW by 2030. We believe
INOX Wind is in a sweet spot to tap the upcoming opportunity in renewable energy
Abs.(%)
3m
1yr
3yr
segments. At the CMP of `101, Inox Wind is trading at 6x FY2020E EPS of `17.4.
Sensex
8.0
19.4
35.2
Considering the above positives, we recommend BUY on Inox Wind and assign a
multiple of 7.5x on FY2020EPS to arrive at a Target Price of `130 (potential upside of
INOXWI
3.8
(8.8)
(74.6)
29% over a period of next 12-18 months).
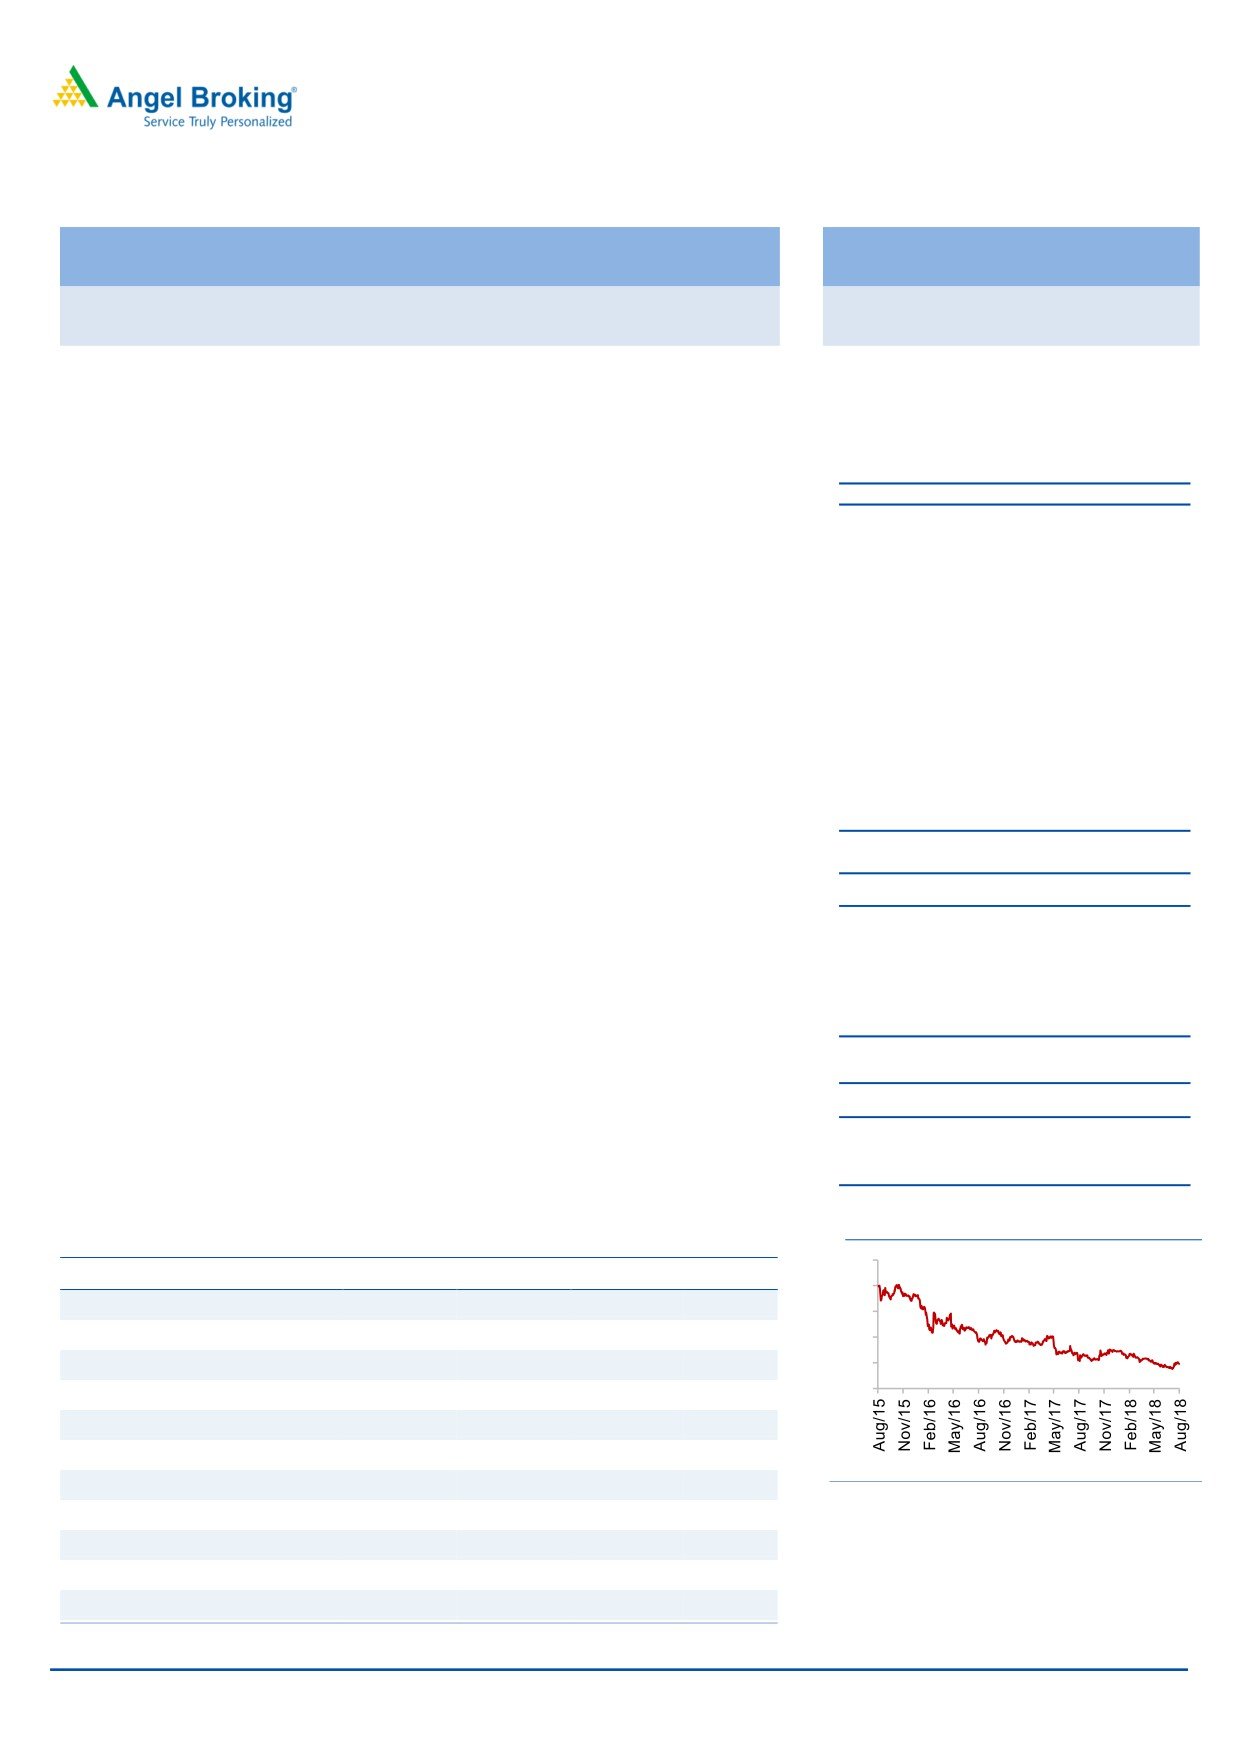
3 Years price performance
Key Financials
500
Y/E March (` cr)
FY16
FY17
FY18
FY19E
FY20E
400
Net Sales
4,451
3,415
480
3,360
3,971
300
% chg
65
(23)
(86)
600
18
200
Net Profit
461
303
(188)
273
385
100
0
% chg
(30)
(34)
(162)
(246)
41
EBITDA (%)
16.0%
16.4%
-17.0%
14.3%
15.3%
EPS (Rs)
21
14
(8)
12
17
P/E (x)
5
8
(12)
8
5.9
Source: C-line, Angel Research
P/BV (x)
1.2
1.0
1.1
1.0
0.9
RoE (%)
24.4
13.9
(9.4)
12.0
14.5
RoCE (%)
20.4
13.9
(4.7)
13.7
15.7
Kripashankar Maurya
022 39357600, Extn: 6004
EV/EBITDA
4.2
5.5
(32.2)
5.8
4.0
Source: Company, Angel Research; Note: CMP as of August 17, 2018
August 20, 2018
1
Inox Wind | Quick Take
Company background
Inox Wind is India’s leading wind energy solutions provider servicing IPPs,
Utilities, PSUs, Corporates and Retail Investors. Inox Wind is a fully integrated
player in the wind energy market with three state-of-the-art manufacturing plants
in Gujarat, Himachal Pradesh and Madhya Pradesh with a cumulative
manufacturing capacity of 1,600MW.
Inox Wind manufactures three variants of the 2 MW WTG:
Rotor diameter of 93 meters with hub height of 80 meters
Rotor Diameter of 100 meters with hub height of 80 / 92 meters
Rotor Diameter of 113 meters with hub height of 92 meters
Rotor Diameter of 113 meters with hub height of 120 meters
Inox Wind owns a 100% subsidiary, Inox Wind Infrastructure Services, which does
the project development in respect of wind power projects, including wind
studies, energy assessments, land acquisition, site infrastructure development,
power evacuation, statutory approvals, erection and commissioning and long
term operation and maintenance of the wind farms.
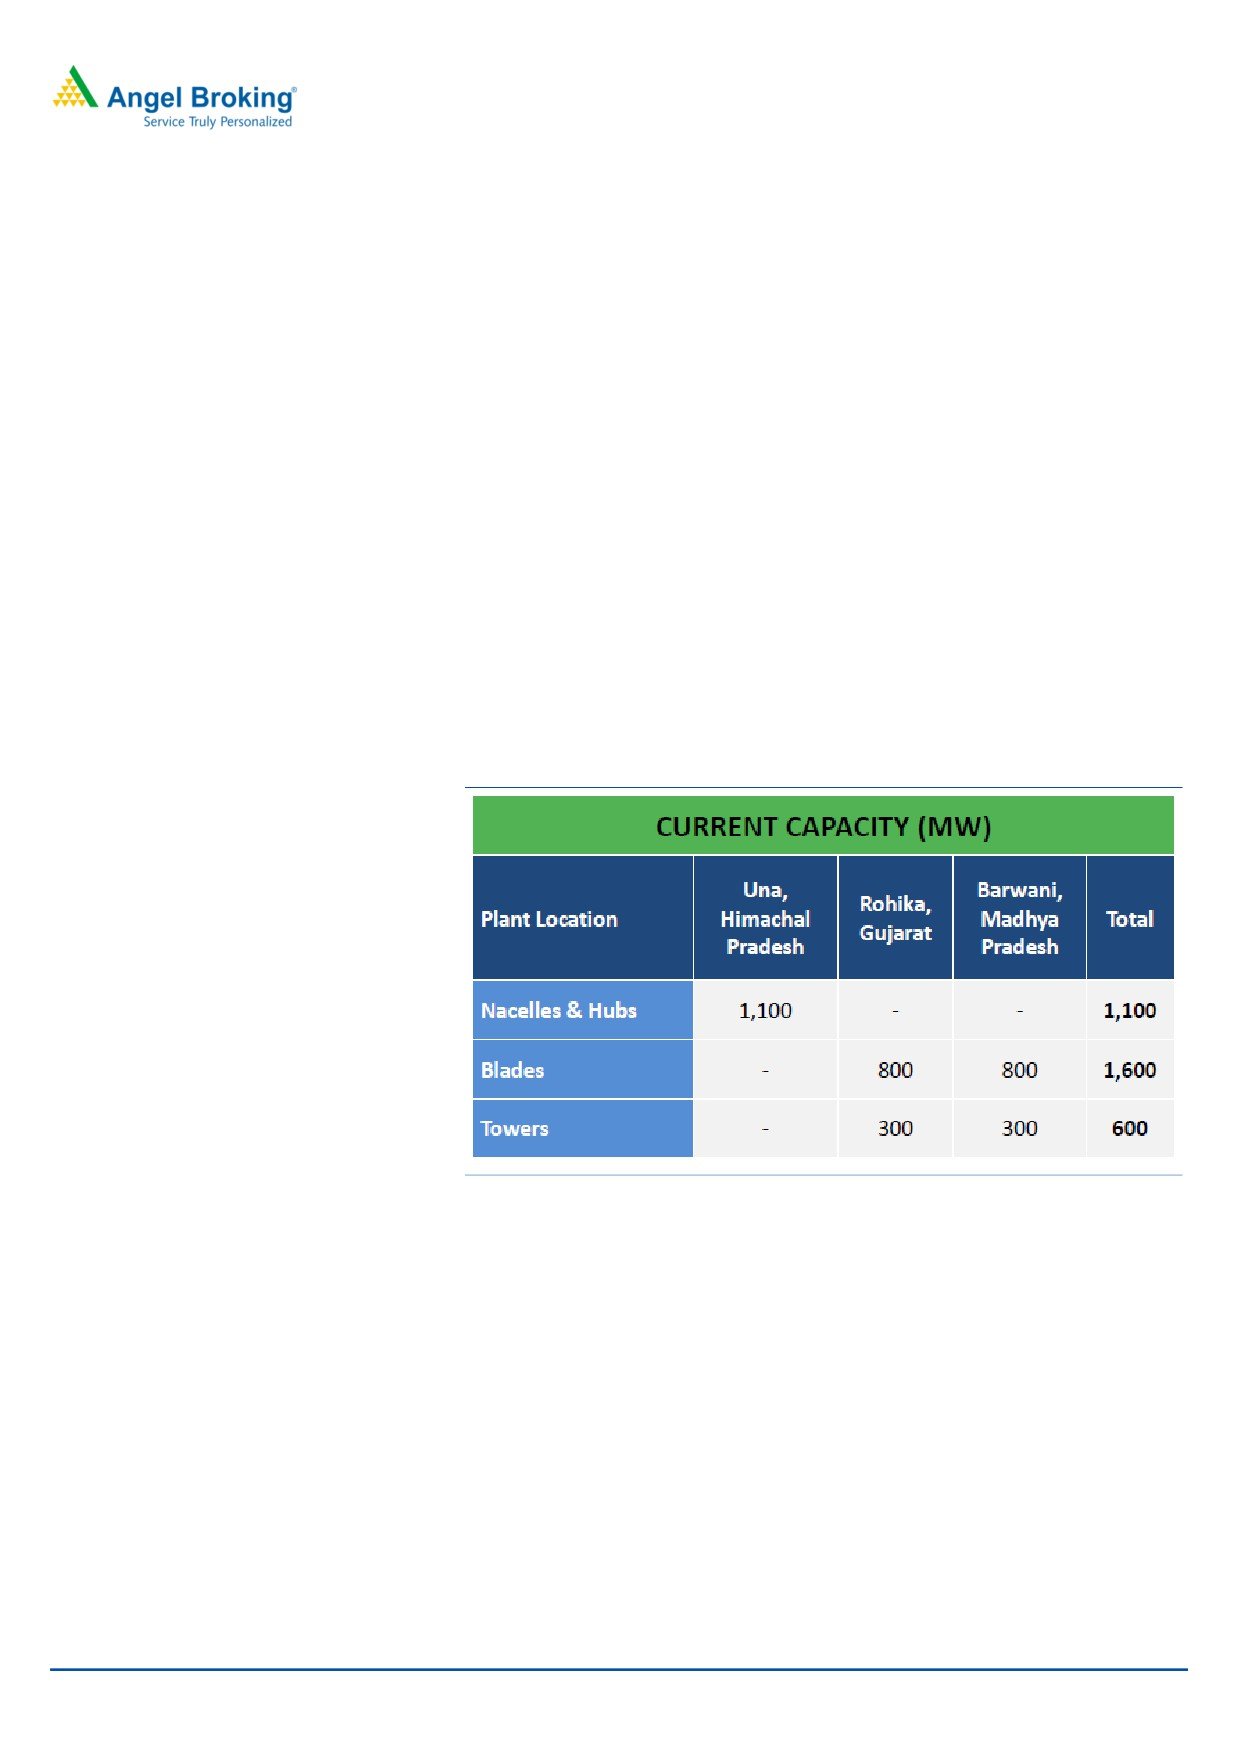
Exhibit 1: Installed capacity
Source: Company, Angel Research
Sector outlook
Overview of renewable energy sector in India
Renewable energy capacity in India has grown at a CAGR of 24% over FY2012-18.
The installed renewable energy generation capacity in India was 69GW as of
March 2018, which represented 20% of the total installed generation base in
India.
However, total electricity generated from the installed renewable energy
capacities (or renewable energy penetration in the grid) still remains low at
approximately 7%, with wind energy garnering maximum share of 4% of the total
energy supplied in the country as on February 2018. There is a significant amount
of potential for renewable energy capacity installations in India.
August 20, 2018
2
Inox Wind | Quick Take
Exhibit 2: Renewable energy Potential
Technology
Potential GW
Cumulative Capacity as of March 18 GW
Wind
302
34.04
Solar ground mounted
749
20.59
Solar Rooftop*#
210
1.06
Biomass+bagasse cogeneration
22.5
8.7
Samll Hydro (upto 25MW)
19.5
4.49
Waste to Energy
NA
0.14
Source: Renew Power Limited (DRHP), Angel Research
*The economically feasible market potential for rooftop solar PV in urban settlements of
India; excludes offgrid/ captive solar capacities
#Excludes estimates of ~1.0 GW of roof top capacities which is not subsidised by the
MNRE
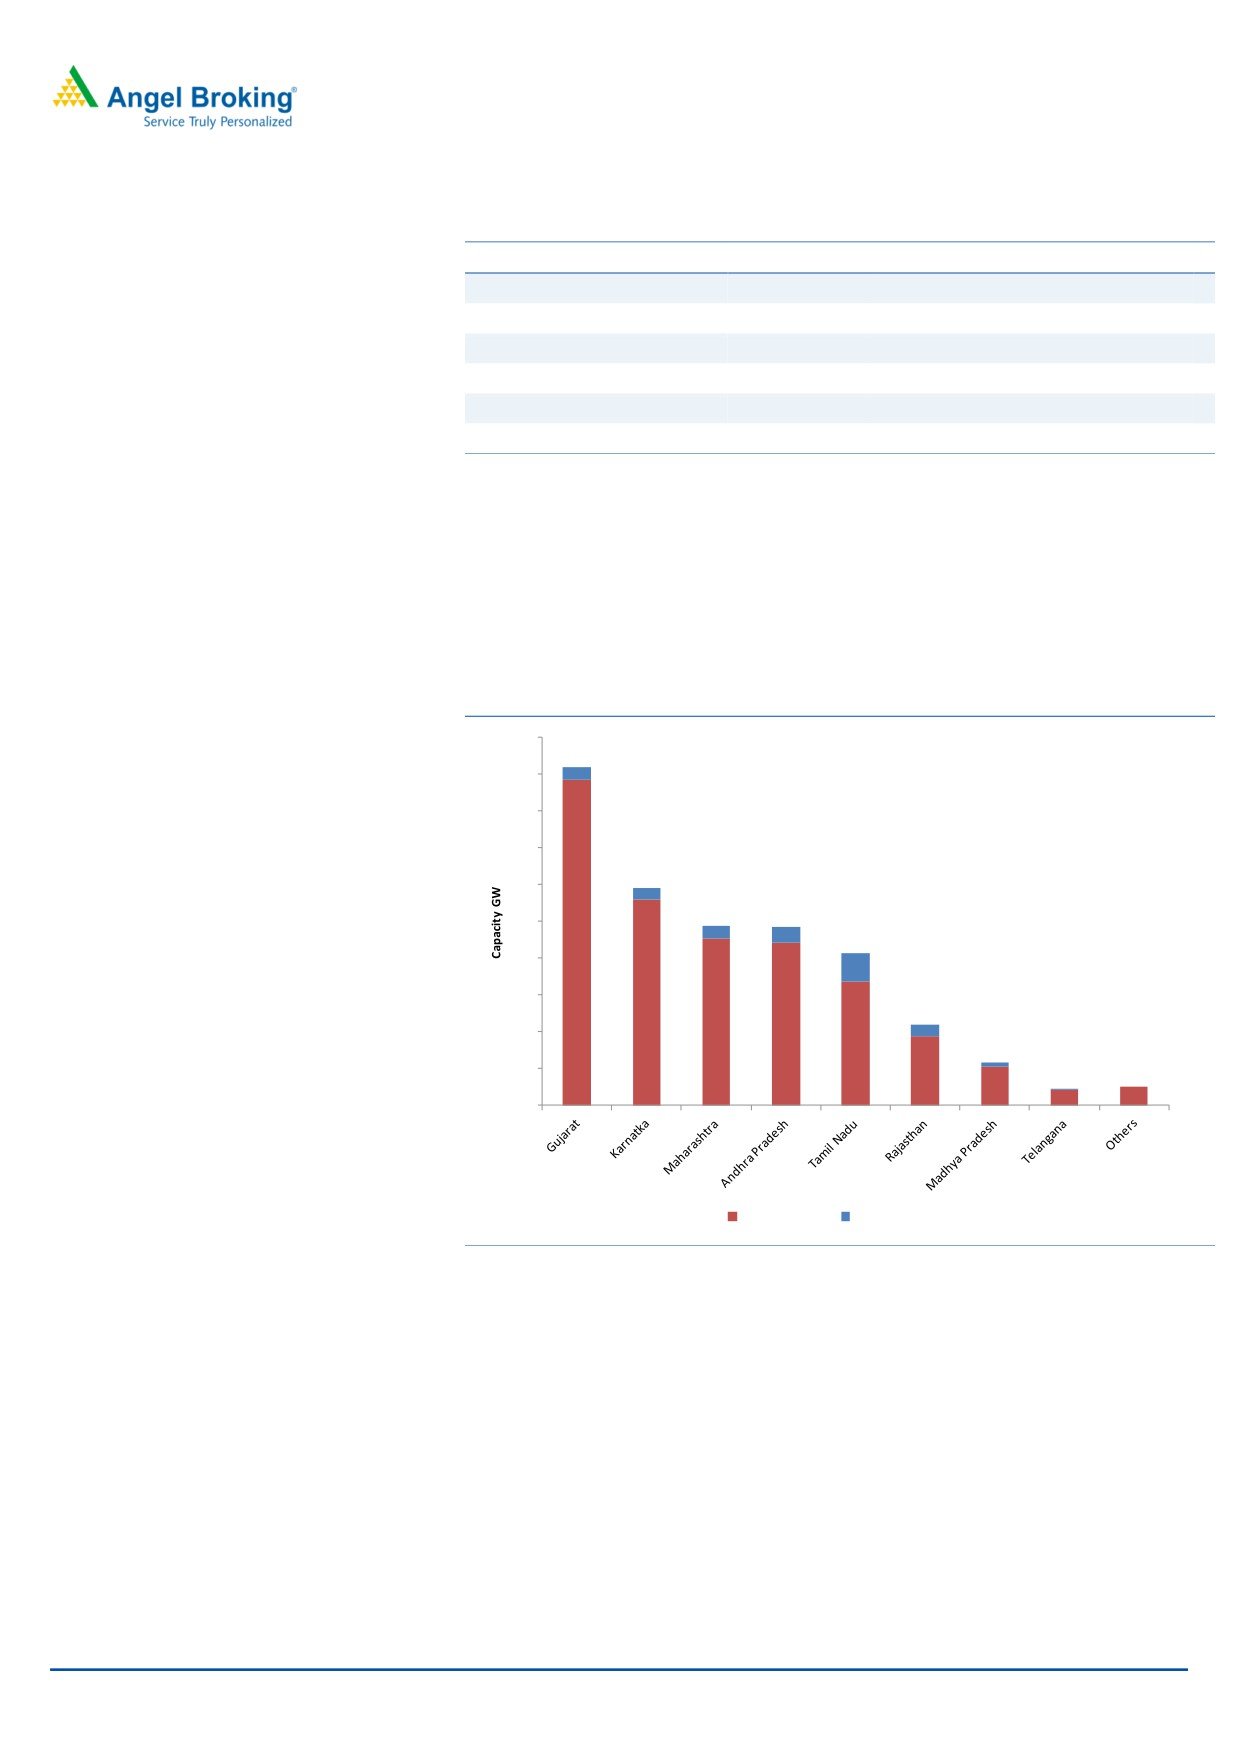
Exhibit 3: State wise estimated potential
100
90
3.4
80
70
60
3.3
50
3.5
4.5
88.4
40
7.5
30
55.9
45.4
44.2
20
3.1
33.8
10
18.8
1.1
10.5
0.0
0.0
4.2
5
0
Potential (GW)
Achived (GW)
Source: Company, Angel Research
Expected improvement in RPO compliance
Going forward, there is likely to be pressure on state discoms to improve RPO
(Renewable Purchase Obligation) compliance to support demand for wind energy.
In fact, under its revised guidelines on the RPO obligations (released in June
2018), the government has proposed a sharp ramp up in total non-solar-based
RPOs to 10.5% by FY22 from 8.75% in FY17, which will drive the demand for
cheaper wind power.
August 20, 2018
3
Inox Wind | Quick Take
Exhibit 4: Current RPO and compliance
Exhibit 5: RPO target
25.0%
8.0%
14.0%
6.8%
21.0%
7.0%
12.0%
19.0%
5.6%
20.0%
17.5%
6.0%
17.0%
5.0%
10.0%
4.7%
5.0%
14.3%
3.8%
8.0%
4.0%
15.0%
3.0%
3.0%
11.5%
6.0%
2.7%
3.0%
2.1%
1.9%
4.0%
2.0%
1.3%
1.4%
1.4%
10.0%
1.0%
1.0%
0.5%
0.7%
2.0%
0.1%
0.1%
0.0%
0.0%
5.0%
Chattisgarh Orissa
Delhi
Jharkhand Haryana
Uttar
Madhya Assam
Bihar
Pradesh Pradesh
Non Solar RPO Target (2016)
Non Solar RPO Compliance (2016)
0.0%
FY17
FY18
FY19
FY20
FY21
FY22
MoP Target for Non-Solar RPO (FY2019)
RPO
Source: CRISIL, Angel Research
Source: MoP (14th June 2018), Angel Research
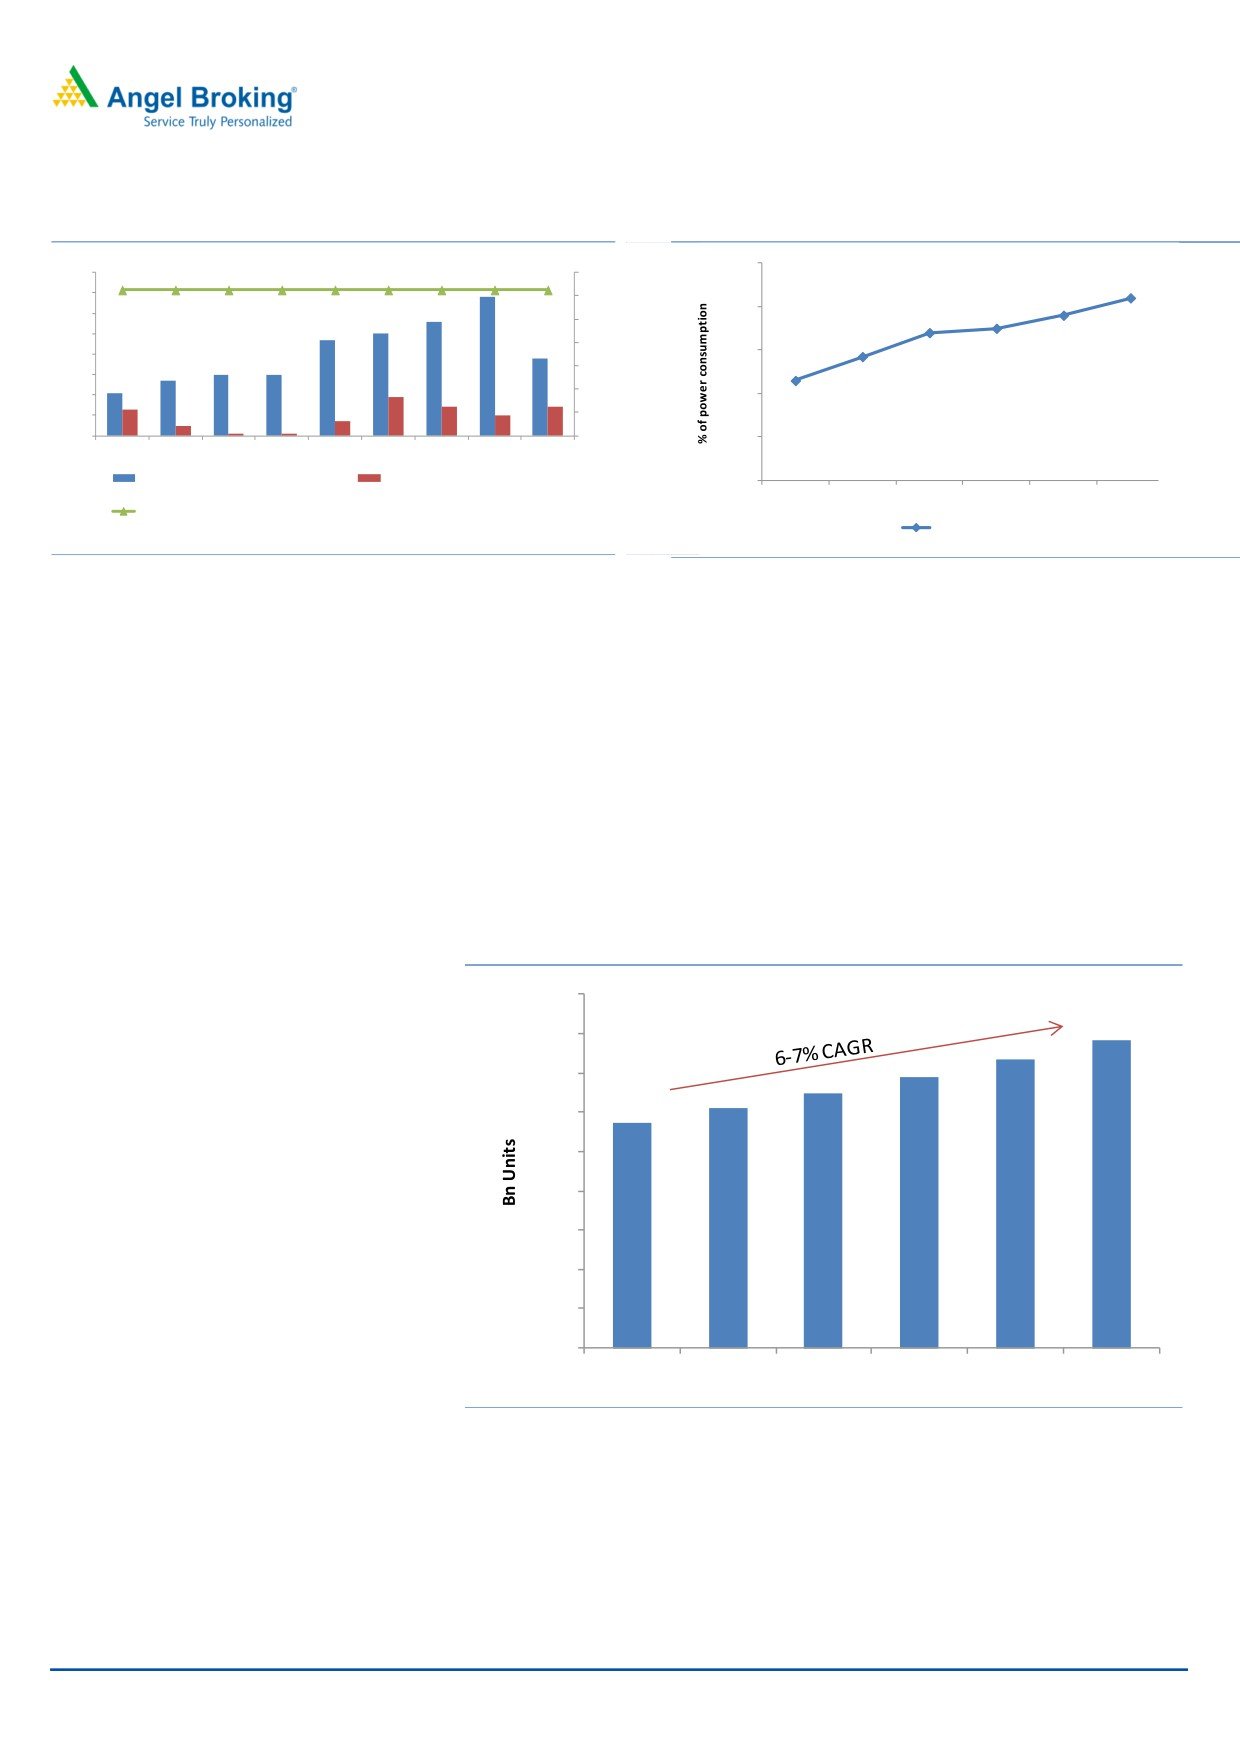
Power demand to grow at 6-6.5% CAGR over FY2019-22
Power demand is expected to register a healthy growth CAGR of 6-6.5% over the
next 5 years i.e. FY2018-22. Industrial demand is expected to grow at a moderate
pace, in-line with GDP growth and gradual pick-up in economic activity. However,
residential demand is expected to witness stronger growth on account of higher
latent demand and rapid urbanization coupled with impetus from government for
rural electrification. Electricity consumption in domestic segment is estimated to
increase at a rapid pace of around 8.5-9% over FY2018-22 and its share in total
electricity consumption is expected to increase to 25% in FY2021 from 23% in
FY2016.
Exhibit 6: Power demand
1800
1566
1600
1400
1143
1200
1000
800
600
400
200
0
FY17P
FY18P
FY19P
FY20P
FY21P
FY22P
Source: CRISIL, Angel Research
Shift from feed-in-tariff regime to auction based tariff regime
The Wind Power industry witnessed a major transition or disruption in FY2018
owing to the migration from a feed-in-tariff (FIT) regime with regulated state
announced tariffs to a reverse auction-based addition of wind capacity, which
encourages competitive bidding and better price discovery. The auction-based
August 20, 2018
4
Inox Wind | Quick Take
regime has led to reduction of power tariffs for the discoms and brought in
greater transparency into the marketplace. It is also expected to expand the wind
turbine market considerably to a 10 GW per annum market compared to a 3-4GW
per annum market historically.
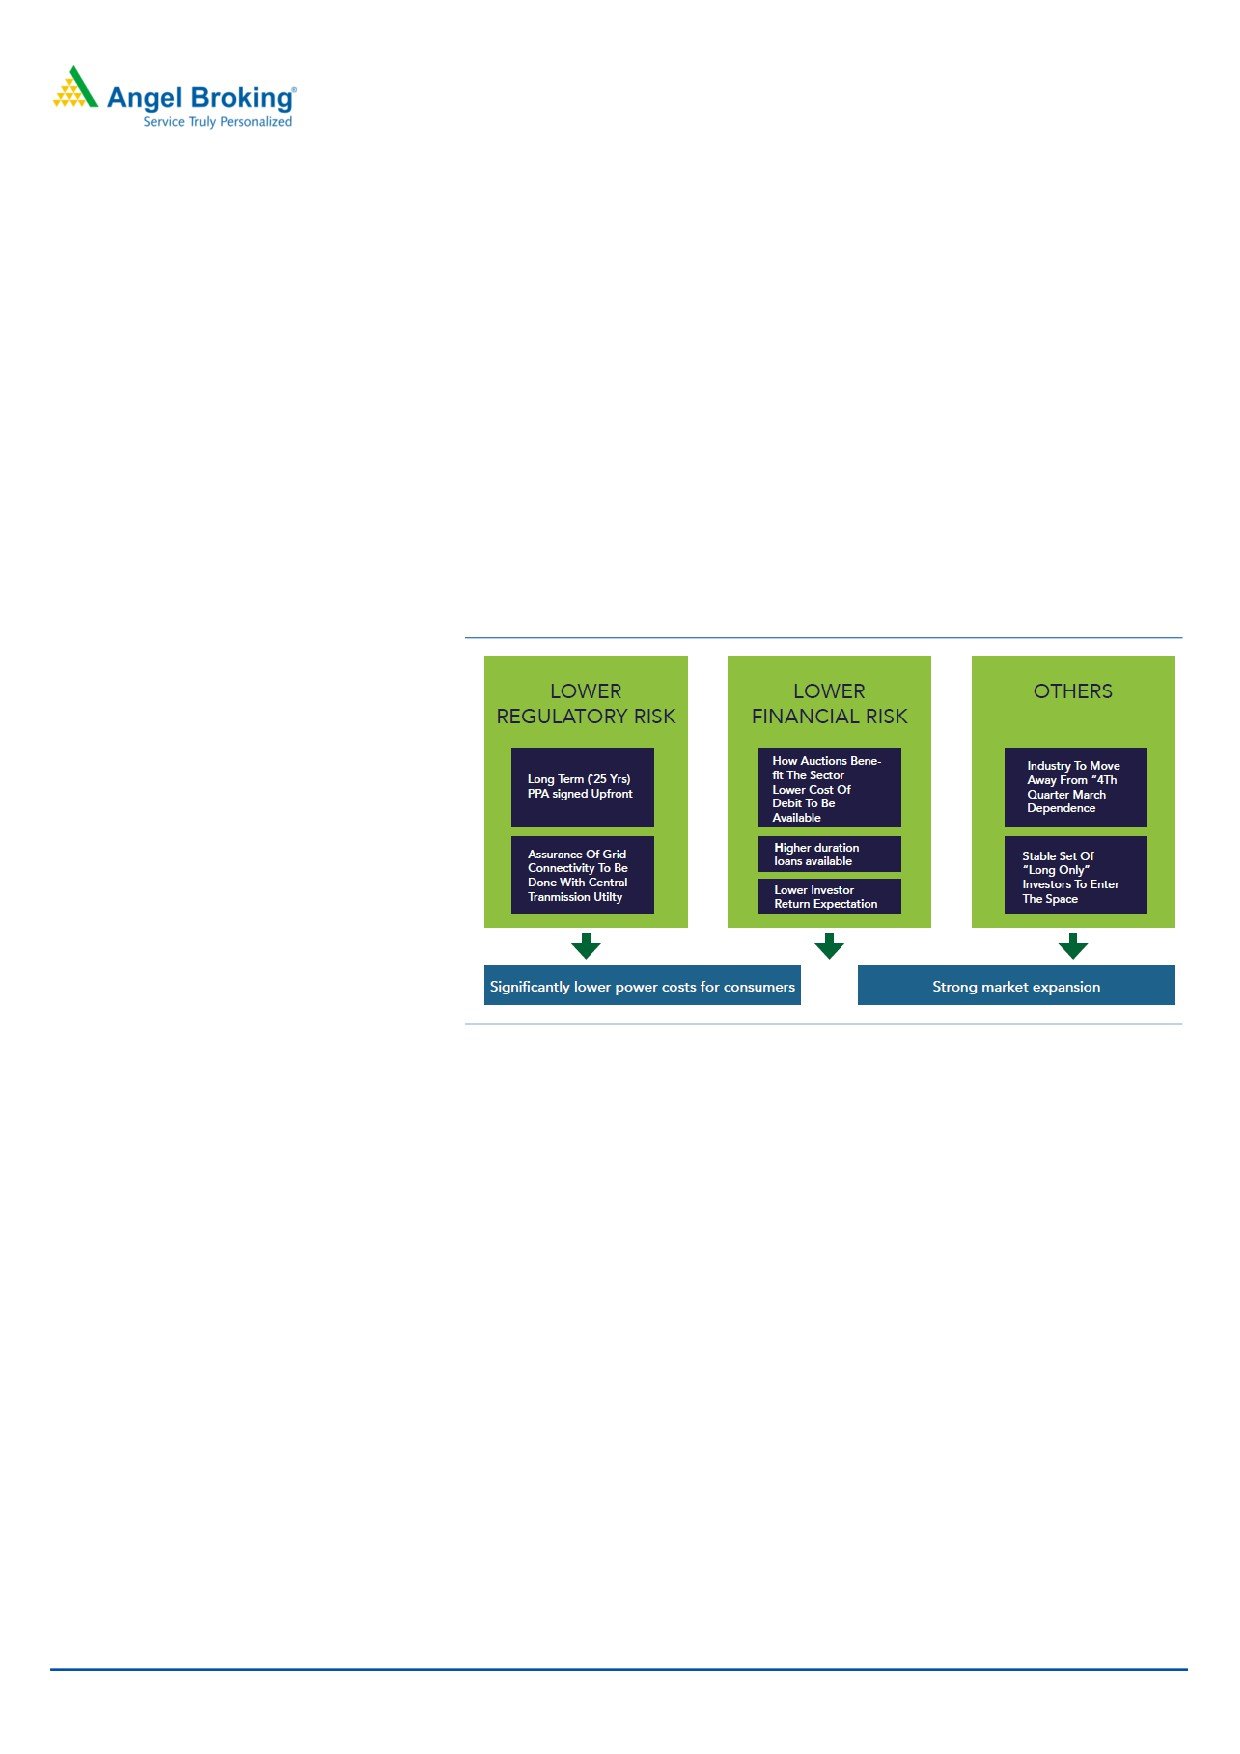
The main advantages of an auction based market include:
• Increased market size
•Reduced regulatory risks for power producers by ensuring upfront signing of
Power Purchase Agreements
•Evacuation of power produced through the central grid ensuring
99%+
availability of the grid
•Increased payment security, given payment from central government bodies
rather than state discoms
Exhibit 7: Reverse auction benefits
Source: Company, Angel Research
Key Investment Argument
Leadership across wind rich states
Inox Wind is the largest project site allottees in Gujarat, Rajasthan and Madhya
Pradesh. It has also expanded presence in Andhra Pradesh, Karnataka and Kerala.
Company owns sufficient project site inventory for the installation of an
aggregate capacity of over 5,000MW.
Strong order book
Inox Wind bagged orders from all the central wind power auctions conducted by
the Solar Energy Corporation of India (SECI) during FY2018 under the auction
regime. It also bagged 50MW in the Maharashtra State auction, which has
enhanced its auction-based order book to a sector-leading 950MW in the Indian
wind power industry. This provides Inox Wind with strong visibility of execution
over the next 12-18 months.
Extending product offering
Inox Wind is working on a 3MW wind turbine suited for the Indian conditions. The
3MW turbine will eventually extend product offerings in India and reinforce Inox
August 20, 2018
5
Inox Wind | Quick Take
Wind’s position as the leading wind turbine manufacturer across the nation. The
development of the 3MW turbines reiterates firm commitment to provide the
clients with superior, energy efficient, resource saving technologies. It will ensure
that Inox Wind continues to play a pioneering role in India’s wind turbine
industry.
Increasing O&M credibility and capabilities going forward
We expect O&M revenue to improve significantly as installed capacity of wind
turbine is increasing every year. Currently, Inox Wind has 2.4GW of wind turbine
installed capacity with multiyear O&M agreements with ~5% escalation clause. A
large part of this fleet has already gone off their two-year warranty period, and
hence the O&M revenues in terms of cash flows would have started flowing in.
Further, O&M revenues are noncyclical in nature. They have steady cash flow
generation and have significantly higher margins than average company margins
and hence would help in the company’s margin profile as well.
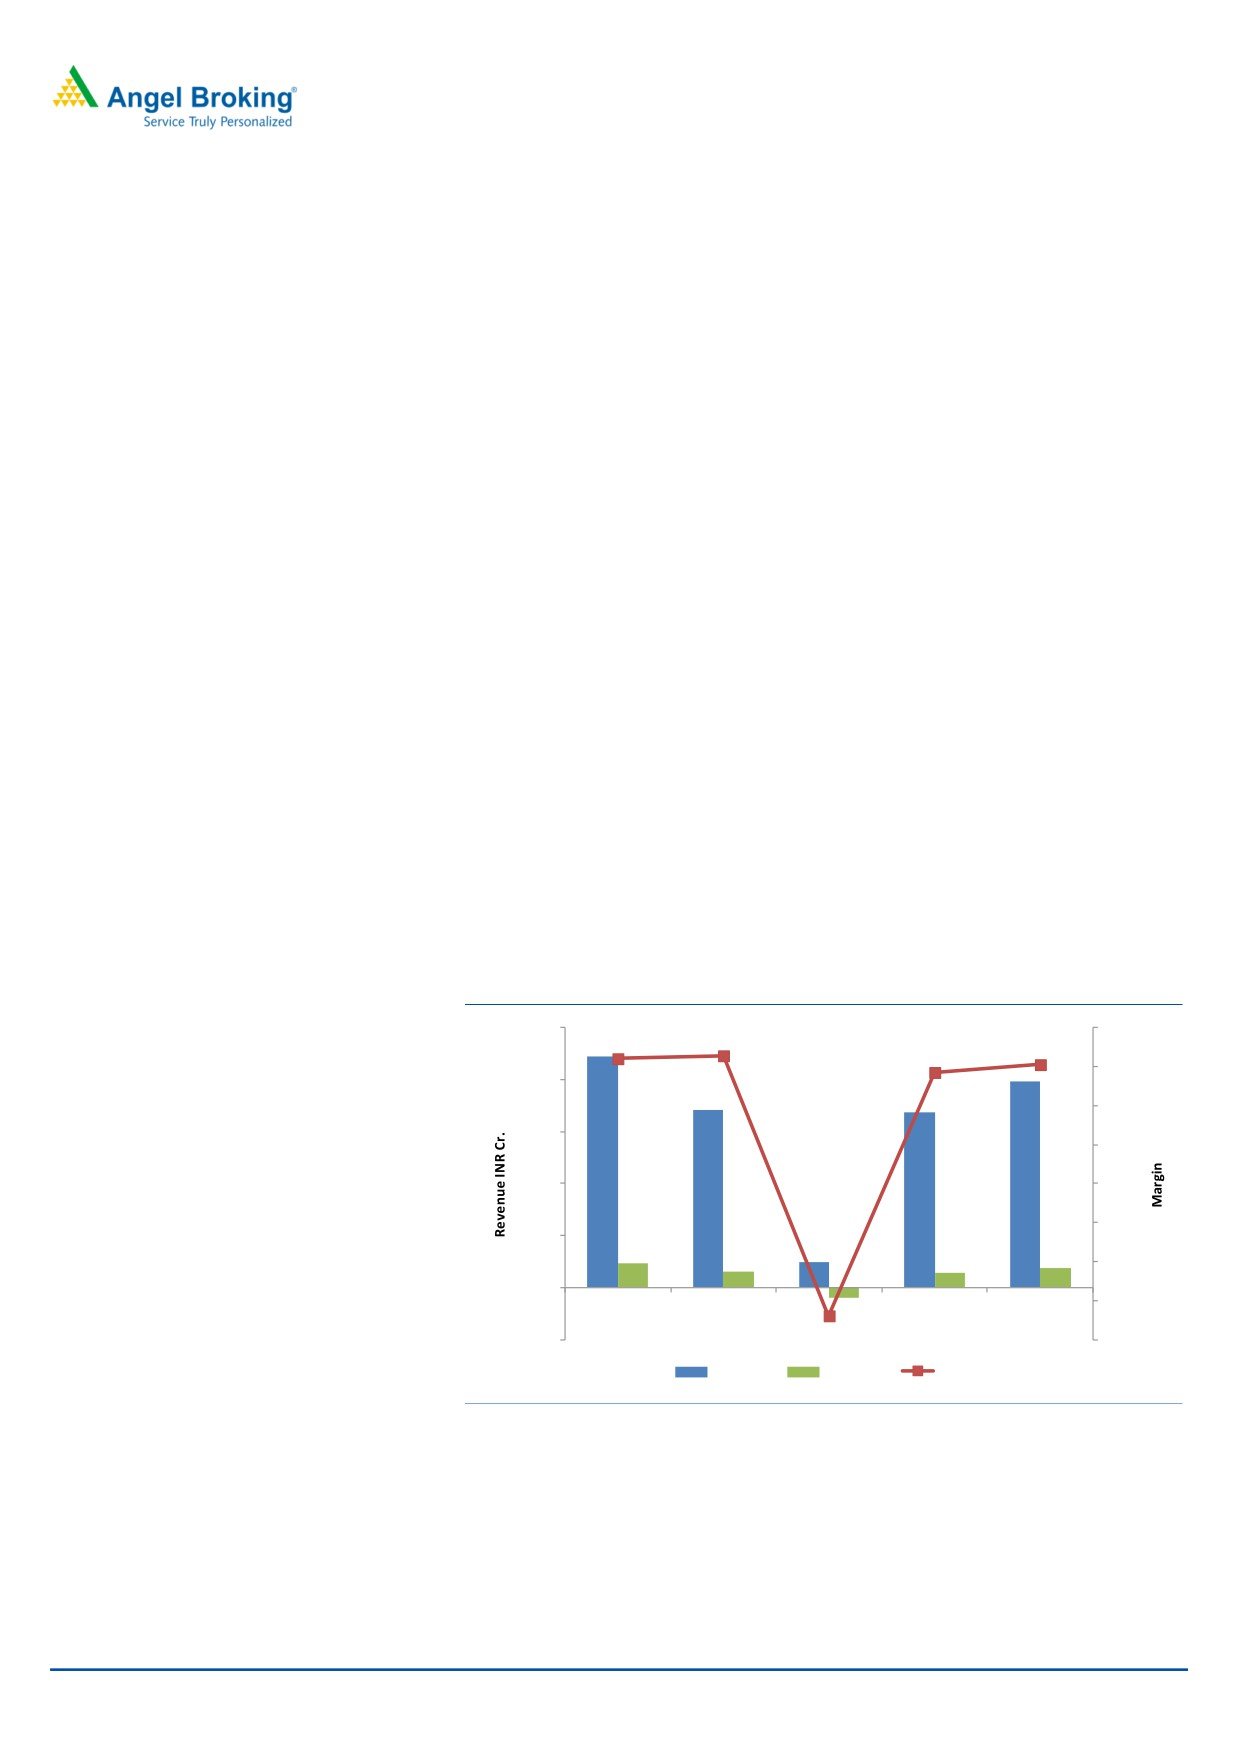
Revenue expected to improve significantly
Wind energy sector has seen tectonic transformation in FY18 due to changes in
Auction regime from FIT regime to Reverse auction regime. This removes
counterparty risks and default in payments. Owing to reduction in uncertainty like
PPA and connectivity, we expect participation in bidding to increase along with
increasing effort of GoI for auctioning of 10GW wind energy every year till 2028,
which creates strong revenue visibility for wind turbine manufactures like Inox
Wind going forward. We expect Inox Wind to report `3,360cr and `3,971cr
revenue in FY19E and FY20E respectively owing to majority of execution from
SECI-I and SECI-II orders.
Exhibit 8: Revenue trend
5000
20%
16%
16%
15%
15%
14%
4000
10%
3000
5%
2000
0%
-5%
1000
-10%
0
-15%
FY16
FY17
FY18
FY19E
FY20E
-17%
-1000
-20%
Net Sales
Net Profit
EBITDA
Source: Company, Angel Research
August 20, 2018
6
Inox Wind | Quick Take
Outlook & Valuation: We expect Inox Wind to report exponential growth in top-
line and bottom-line over FY2019-20E. The growth would be led by changing
renewable energy industry dynamics in favor of wind energy segment viz.
changes in auction regime from Feed-In-Tariff (FIT) to Reverse auction regime and
Government’s guidance for increasing wind energy capacity from 34GW currently
to 140GW by 2030. We believe INOX Wind is in a sweet spot to tap the upcoming
opportunity in renewable energy segments. At the CMP of `101, Inox Wind is
trading at 6x FY2020E EPS of
`17.4. Considering the above positives, we
recommend BUY on Inox Wind and assign a multiple of 7.5x on FY2020EPS to
arrive at a Target Price of `130 (potential upside of 29% over a period of next 12-
15 months).
Risk and Concern
Delay in auction
Any delay in auction of wind energy may leads to slowdown in sector hence
create an uncertainty in revenue visibility.
Lower bidding
Due to introduction of reverse auction bidding which reduces the uncertainty with
respect to PPA and connective issues, encourages the participation of Investor
which may increase the probability of lower biding in future.
August 20, 2018
7
Inox Wind | Quick Take
Income Statement
Y/E March (` cr)
FY16
FY17
FY18
FY19E
FY20E
Total operating income
4,451
3,415
480
3,360
3,971
% chg
65
(23)
(86)
600
18
Total Expenditure
3,737
2,855
561
2,881
3,364
Raw Material
2,716
1,920
47
1,983
2,303
Personnel
92
117
100
168
199
Selling and Administration Expenses
21
-19
-1
-9
-11
Others Expenses
908
836
416
739
874
EBITDA
713
560
-81
479
606
% chg
(22)
(21)
(115)
(689)
26
(% of Net Sales)
16.0%
16.4%
-17.0%
14.3%
15.3%
Depreciation& Amortisation
36
44
52
55
59
EBIT
677
517
-134
425
547
% chg
(25)
(24)
(126)
(418)
29
(% of Net Sales)
15
15
-28
13
14
Interest & other Charges
98
155
171
82
56
Other Income
70
65
24
27
29
Extraordinary Items
-
-
-
Recurring PBT
649
427
-280
369
520
% chg
(24)
(34)
(166)
(232)
41
Tax
188
124
-93
96
135
PAT (reported)
461
303
-188
273
385
% chg
(46)
(34)
(162)
(246)
41
(% of Net Sales)
10.4
8.9
-39.1
8.1
9.7
Basic & Fully Diluted EPS (Rs)
21
14
-8
12
17
% chg
(97)
(34)
(162)
(246)
41
Source: Company, Angel Research
August 20, 2018
8
Inox Wind | Quick Take
Balance sheet
Y/E March (`cr)
FY16
FY17
FY18
FY19E FY20E
SOURCES OF FUNDS
Equity Share Capital
221.9
221.9
221.9
221.9
221.9
Reserves& Surplus
1,665
1,968
1,782
2,056
2,441
Shareholders Funds
1,887
2,190
2,004
2,278
2,663
Total Loans
1,437
1,528
831
831
831
Other Liabilities
50
113
33
355
355
Total Liabilities
3374
3831
2868
3463
3848
APPLICATION OF FUNDS
Net Block
569
765
985
1,062
1,098
Capital Work-in-Progress
43
112
20
20
20
Investments
-
53
0
-
-
Long Term Loans & Advances
12
16
15
15
15
Current Assets
3,895
3,938
2,708
3,424
4,028
Inventories
560
690
929
690
816
Sundry Debtors
2,409
2,382
1,339
2,302
2,393
Cash
494
437
127
170
500
Loans & Advances
304
87
0
0
0
Investments & Others
128
341
313
262
318
Current liabilities
1,404
1,324
1,230
1,261
1,514
Net Current Assets
2,491
2,614
1,478
2,164
2,514
Other Non Current Asset
260
270
370
203
203
Total Assets
3374
3831
2868
3463
3848
Source: Company, Angel Research
August 20, 2018
9
Inox Wind | Quick Take
Cash flow
Y/E March (`cr)
FY16
FY17
FY18
FY19E FY20E
Profit before tax
649
427
(280)
369
520
Depreciation
36
44
52
55
59
Change in Working Capital
283
(436)
(669)
525
(215)
Interest / Dividend (Net)
98
155
171
82
56
Direct taxes paid
188
124
(93)
96
135
Others
(1,418)
(200)
1,088
(785)
129
Cash Flow from Operations
(163)
114
269
342
686
(Inc.)/ Dec. in Fixed Assets
(404)
(290)
(186)
(272)
(99)
(Inc.)/ Dec. in Investments
(31)
(111)
302
0
-
Cash Flow from Investing
(968)
(5)
332
(272)
(99)
Issue of Equity
-
-
-
-
-
Inc./(Dec.) in loans
1,403
90
-697
-
-
Others
(901)
(71)
(63)
55
(256)
Cash Flow from Financing
501
19
(760)
55
(256)
Inc./(Dec.) in Cash
(630)
128
(159)
124
331
Opening Cash balances
706
76
204
46
170
Closing Cash balances
76
204
46
170
500
Source: Company, Angel Research
August 20, 2018
10
Inox Wind | Quick Take
Valuation Ratios
Y/E March
FY16
FY17
FY18
FY19E FY20E
P/E (on FDEPS)
5
8
-12
8
6
P/CEPS
5
7
-17
7
5
P/BV
1
1
1
1
1
EV/Sales
1
1
5
1
1
EV/EBITDA
4
6
-32
6
4
EV / Total Assets
6
6
5
5
4
Per Share Data (`)
EPS (Basic)
21
14
-8
12
17
EPS (fully diluted)
21
14
-8
12
17
Cash EPS
22
16
-6
15
20
DPS
0
0
0
0
0
Book Value
85
99
90
103
120
Returns (%)
ROCE
20
14
-5
14
16
Angel ROIC (Pre-tax)
24
16
-5
13
16
ROE
24
14
-9
12
14
Turnover ratios (x)
Inventory / Sales (days)
46
74
707
75
75
Receivables (days)
198
255
1018
250
220
Payables (days)
97
104
408
110
110
Working capital cycle (ex-cash) (days)
146
225
1317
215
185
Source: Company, Angel Research
August 20, 2018
11
Inox Wind | Quick Take
Research Team Tel: 022 - 39357800
DISCLAIMER
DISCLAIMER:
Angel Broking Private Limited (hereinafter referred to as “Angel”) is a registered Member of National Stock Exchange of India Limited,
Bombay Stock Exchange Limited and Metropolitan Stock Exchange Limited. It is also registered as a Depository Participant with CDSL
and Portfolio Manager and Investment Adviser with SEBI. It also has registration with AMFI as a Mutual Fund Distributor. Angel
Broking Private Limited is a registered entity with SEBI for Research Analyst in terms of SEBI (Research Analyst) Regulations, 2014
vide registration number INH000000164. Angel or its associates has not been debarred/ suspended by SEBI or any other regulatory
authority for accessing /dealing in securities Market. Angel or its associates/analyst has not received any compensation / managed or
co-managed public offering of securities of the company covered by Analyst during the past twelve months.
This document is solely for the personal information of the recipient, and must not be singularly used as the basis of any investment
decision. Nothing in this document should be construed as investment or financial advice. Each recipient of this document should
make such investigations as they deem necessary to arrive at an independent evaluation of an investment in the securities of the
companies referred to in this document (including the merits and risks involved), and should consult their own advisors to determine
the merits and risks of such an investment.
Reports based on technical and derivative analysis center on studying charts of a stock's price movement, outstanding positions and
trading volume, as opposed to focusing on a company's fundamentals and, as such, may not match with a report on a company's
fundamentals. Investors are advised to refer the Fundamental and Technical Research Reports available on our website to evaluate the
contrary view, if any
The information in this document has been printed on the basis of publicly available information, internal data and other reliable
sources believed to be true, but we do not represent that it is accurate or complete and it should not be relied on as such, as this
document is for general guidance only. Angel Broking Pvt. Limited or any of its affiliates/ group companies shall not be in any way
responsible for any loss or damage that may arise to any person from any inadvertent error in the information contained in this
report. Angel Broking Pvt. Limited has not independently verified all the information contained within this document. Accordingly, we
cannot testify, nor make any representation or warranty, express or implied, to the accuracy, contents or data contained within this
document. While Angel Broking Pvt. Limited endeavors to update on a reasonable basis the information discussed in this material,
there may be regulatory, compliance, or other reasons that prevent us from doing so.
This document is being supplied to you solely for your information, and its contents, information or data may not be reproduced,
redistributed or passed on, directly or indirectly.
Neither Angel Broking Pvt. Limited, nor its directors, employees or affiliates shall be liable for any loss or damage that may arise from
or in connection with the use of this information.
Disclosure of Interest Statement
Company Name
1. Financial interest of research analyst or Angel or his Associate or his relative
No
2. Ownership of 1% or more of the stock by research analyst or Angel or associates or
No
relatives
3. Served as an officer, director or employee of the company covered under Research
No
4. Broking relationship with company covered under Research
No
August 20, 2018
12